
Engineering notes
How close is too close? A bank run stress test
Dr. Anastasiia Zbandut, Quantitative Modeling & Empirical Research, Blockworks Advisory
July 13, 2026 · 13 min read
All notesThis piece estimates bank run style liquidity risk across ten Morpho lending vaults. It analyzes how close each one sits, today, to the utilization level at which its redemption mechanism locks up and withdrawals stop clearing. Only one vault in the sample currently sits on that line. The other nine vaults, together holding roughly $648M of the sample's tracked deposits, do not, and seven of those nine have never touched their own stress line once in 180 days. That line is set per vault by loan asset class, because a stablecoin lending market and a volatile asset lending market do not carry the same amount of danger at the same utilization level.
Morpho is a lending protocol on which independent curators operate "MetaMorpho" vaults which are pooled deposit contracts that allocate capital across individual lending markets and charge a fee for doing so. Depositors hold a claim on the vault and exit by redeeming vault shares for the underlying asset. That redemption is subject to one mechanical constraint where a vault can only pay out what is not currently borrowed out across its markets. When utilization, the share of deposits currently on loan, approaches 100%, the vault runs out of cash to redeem shares. There is no overdraft, no discount window, and no lender of last resort, which is what separates this risk from a textbook bank run, a distinction this piece returns to directly.
Why one threshold does not fit all vaults
A stablecoin vault operating at 95% utilization is typically deploying capital efficiently where redemptions are usually small relative to TVL, demand for the borrowed asset is deep, and large depositors behave differently from retail. A volatile asset vault at 95% utilization is a different animal, thinner secondary liquidity, more volatile borrow demand, less room to absorb a large single withdrawal without the pool running dry. Grouping both under one stress threshold erases that distinction.
This analysis classifies each vault by its loan asset into one of three bands and assigns a stress threshold and a kink to each with a generic stablecoin band (98% stress, 90% kink) covering USDC, USDT, PYUSD, and msUSD loan assets, a higher tolerance band (99.9% stress, 90% kink) for Steakhouse Ethena USDtb, whose loan asset, an institutionally oriented stablecoin, is the basis for that classification, its 12 lenders (one holding 99.4% of shares) being observably large and non-retail is additional context consistent with the classification, not an independent criterion for it. And a volatile asset band (88% stress, 75% kink) covers the two vaults lending WETH and WBTC. Seven of the ten vaults in this sample fall in the stablecoin band, one in the higher tolerance band, two in the volatile band.
The exposure shape
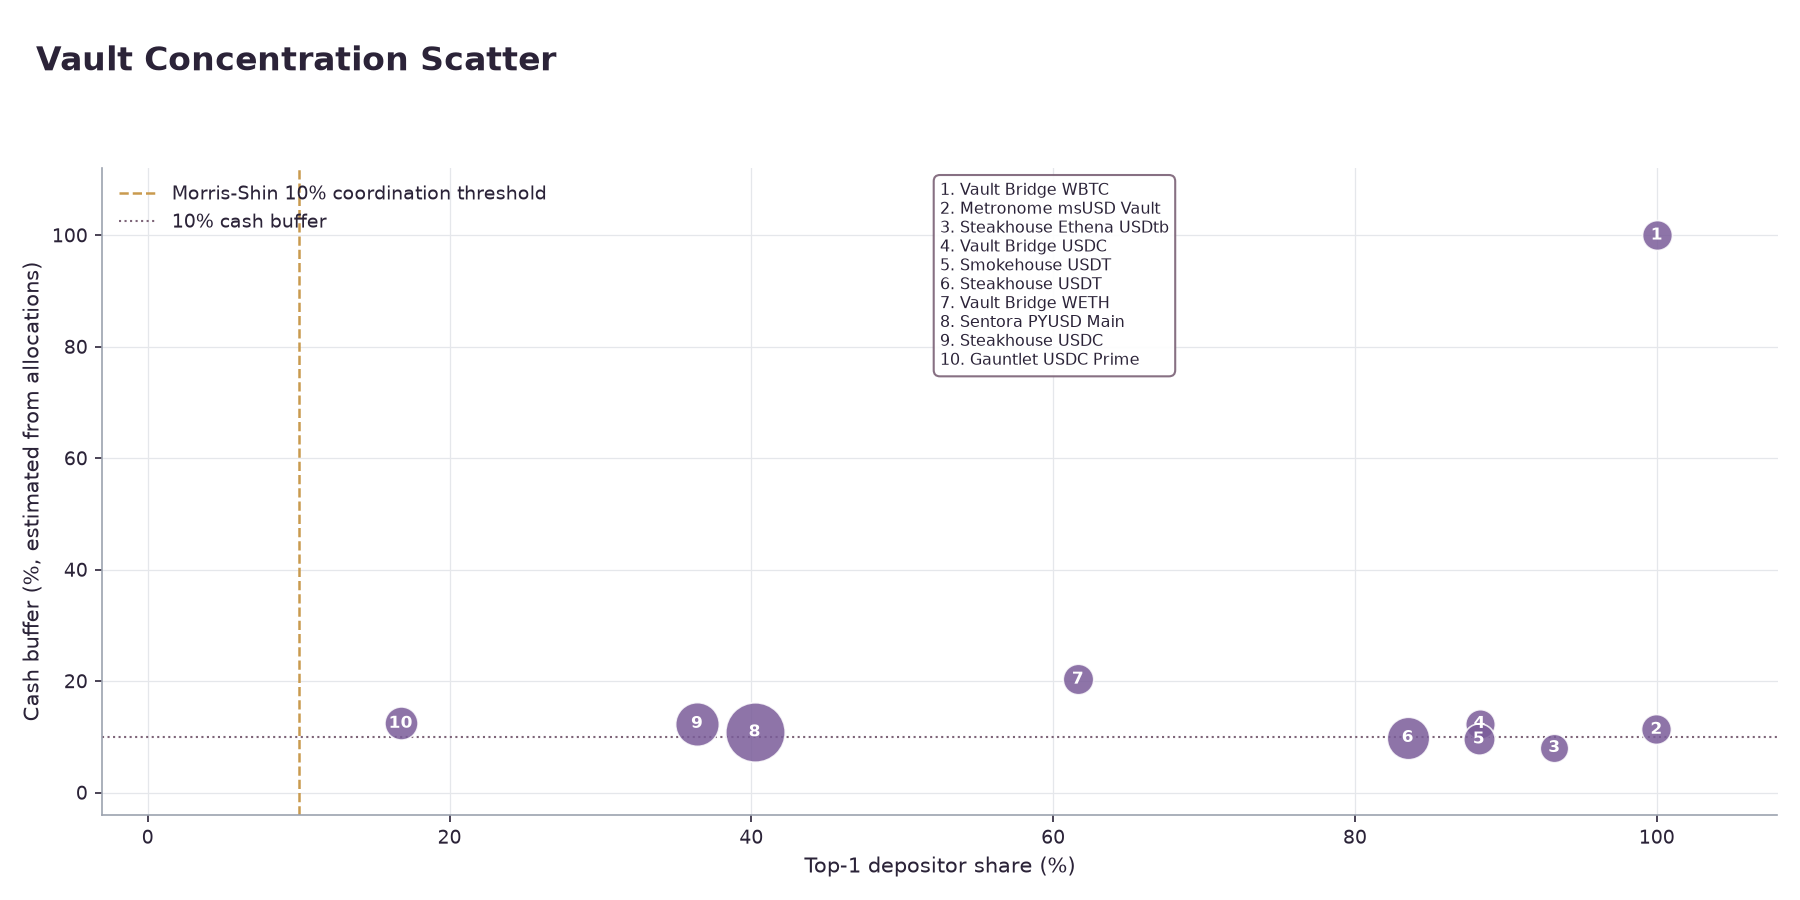
The ten vaults in this sample range from $20.1M to $325.9M in total value locked and vary enormously in depositor concentration. Five vaults, Vault Bridge WBTC, Metronome msUSD Vault, Steakhouse Ethena USDtb, Smokehouse USDT, and Vault Bridge USDC, have a single depositor holding 88% or more of vault shares. At the other end, Gauntlet USDC Prime's largest depositor holds 16.7% of shares, the lowest top-1 concentration in the sample and still 6.7pp above the 10% line below which Morris and Shin's coordination model treats withdrawal decisions as effectively independent rather than mutually reinforcing. That threshold comes from a private information global game, however, Morpho's utilization is fully public, so the 10% cutoff is best read as an illustrative benchmark and not a parameter calibrated to this setting. All ten vaults in this sample sit above that 10% line. By the standard coordination fragility read, none has a depositor base diffuse enough to rule out coordinated withdrawal behavior on priors alone.
Measuring distance to the wall
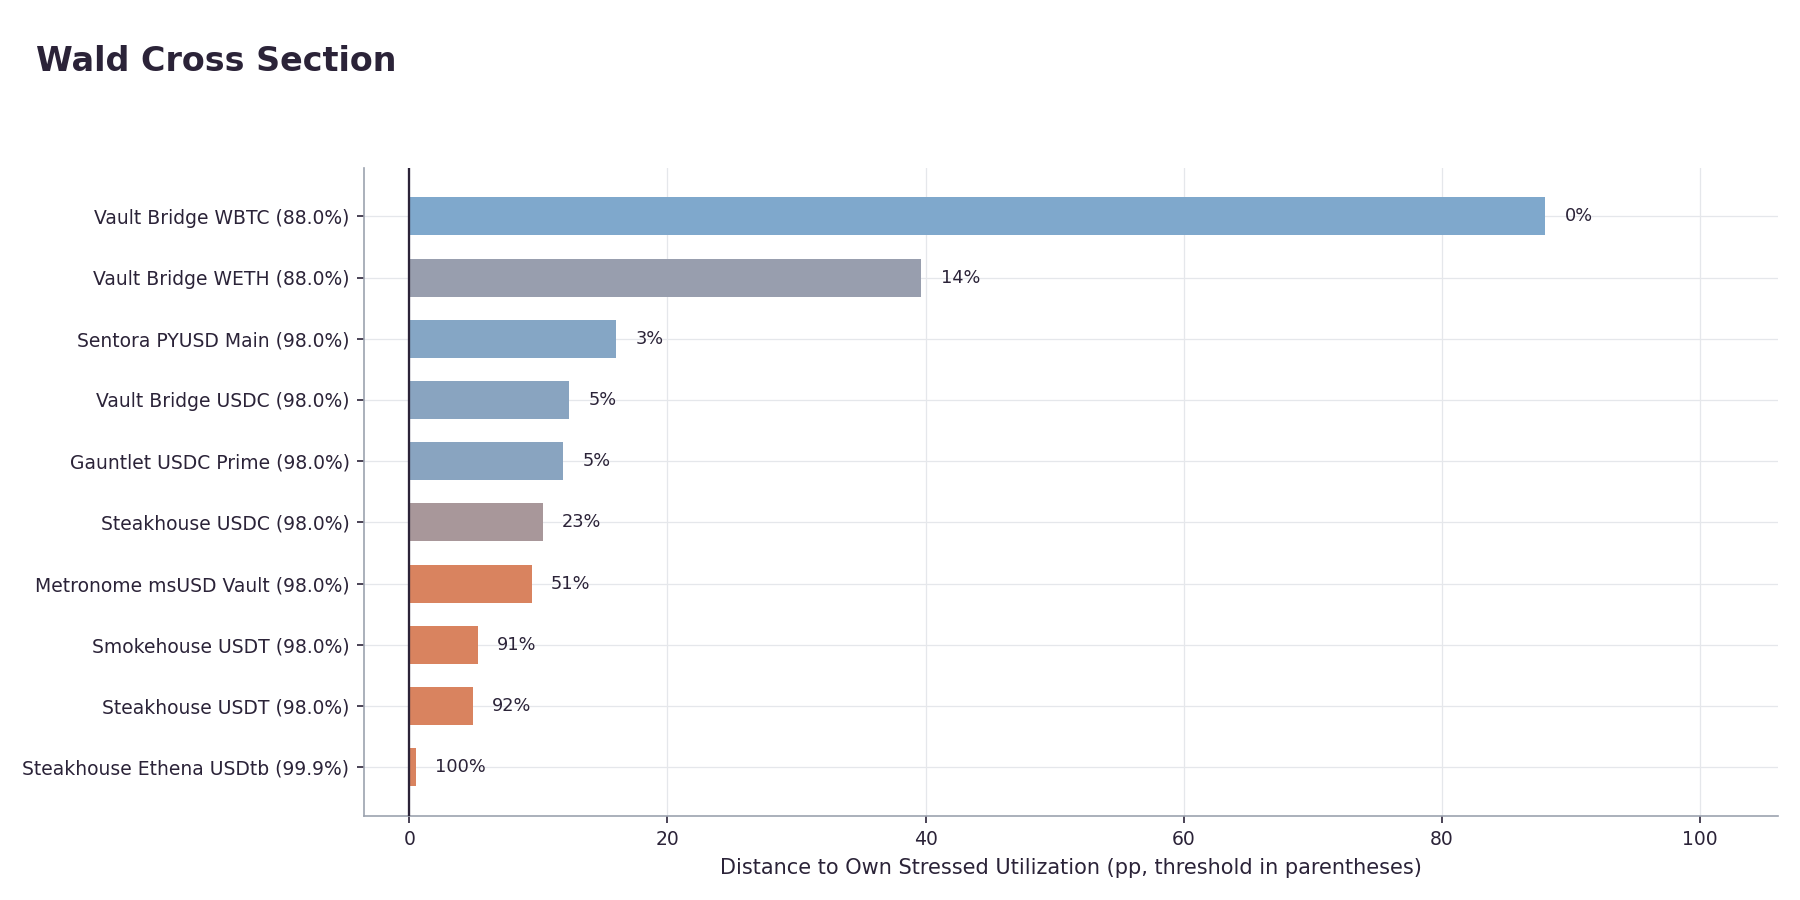
Utilization is a bounded random walk with a hard ceiling, so the natural tool for asking "how close is a vault to its stress line" is a first passage model and can not be estimated as static percentile. This analysis uses a Wald (inverse Gaussian) first passage probability: given a vault's current utilization, its estimated daily drift, its estimated daily volatility, and its own asset class stress line, what is the probability utilization crosses that line within 30 days. Drift and volatility are both estimated with an exponentially weighted moving average (EWMA), which down weights older observations at a rate set by a decay parameter called lambda.
Lambda is not a free styling choice, it determines how much weight the model places on the last few days versus the last few months, and it materially changes the answer. A single lambda pooled across all ten vaults is vulnerable to contamination from a near degenerate series: Vault Bridge WBTC's effectively zero utilization sits near a boundary and pulls the pooled estimate around depending on which window is used to fit it. A pooled fit on the full 180-day window gives 0.956, while a pooled fit on only the first 90 days gives 0.912, a 4.4pp swing driven largely by that one series, and the shorter window estimate sits below the own value used for every vault in the sample except Steakhouse Ethena USDtb's, Gauntlet USDC Prime's, and Vault Bridge USDC's. This analysis instead fits lambda per vault by maximum likelihood, which avoids that window dependent instability. Per vault lambda ranges from 0.885 (Steakhouse Ethena USDtb, the fastest adapting) to 0.990 (Vault Bridge WETH, the slowest), with Vault Bridge WBTC assigned the cross vault median of 0.939 as a fallback, since its own series is too flat to identify a decay rate.
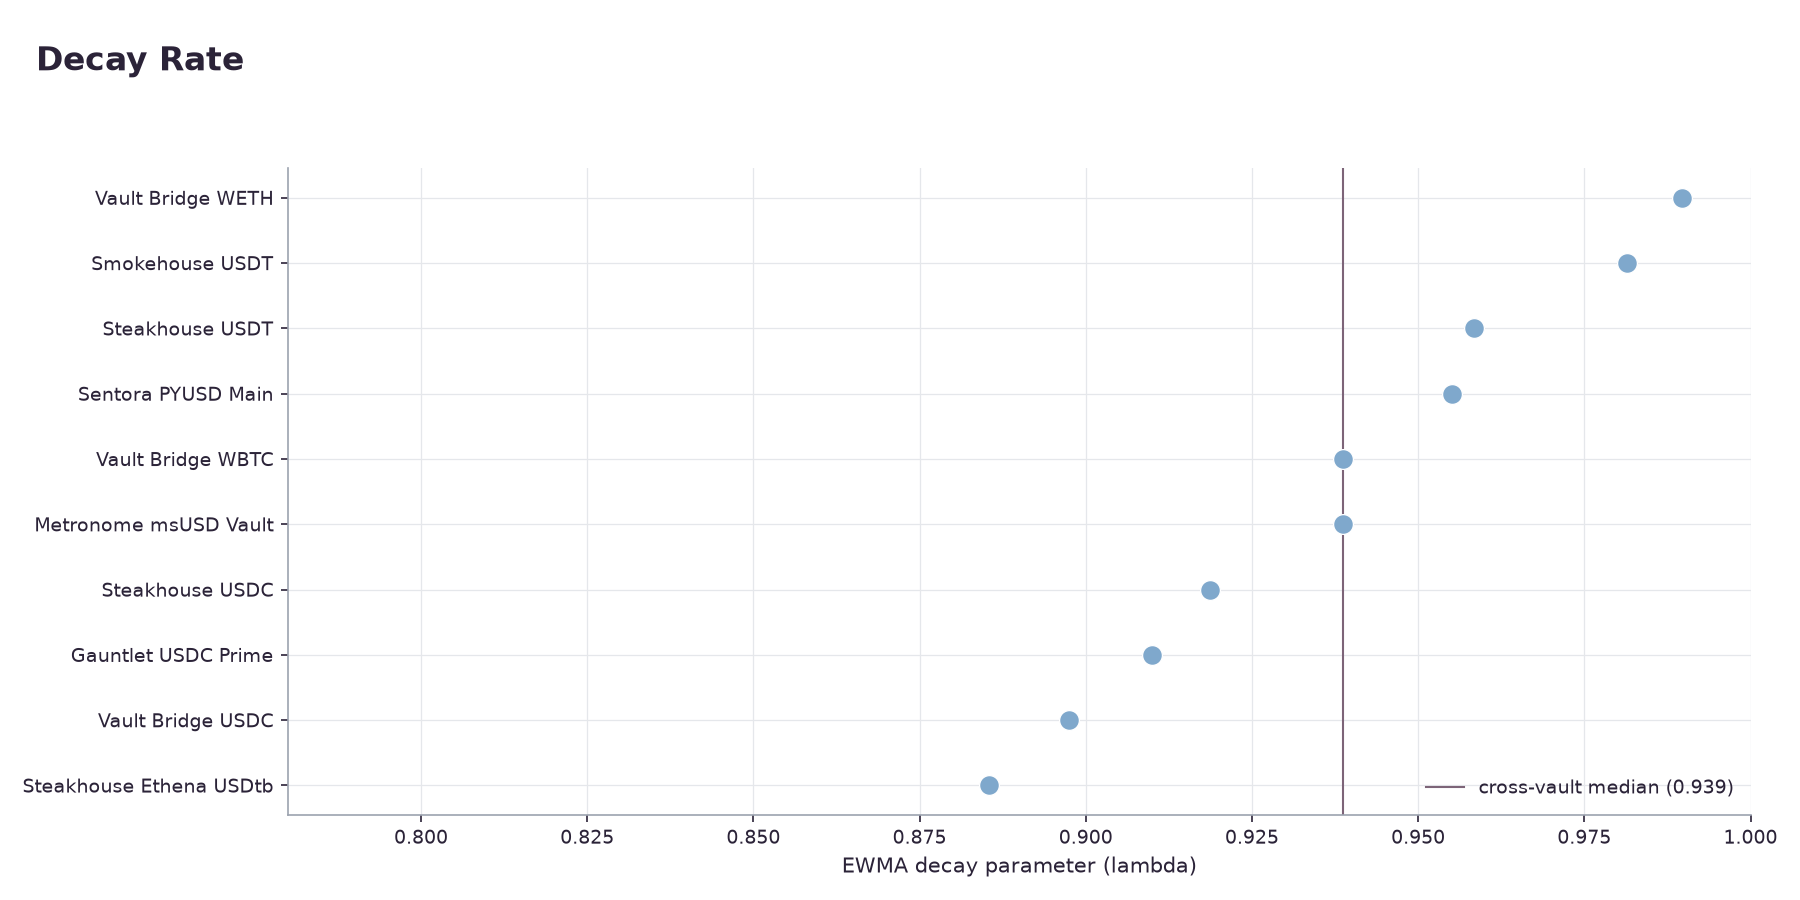
The choice of lambda still matters, though less dramatically than the size of the effective headroom might suggest. Holding the daily panel fixed and comparing a single pooled lambda (0.956, close to the common 0.94 industry default) against each vault's own maximum likelihood estimate, most vaults move by only one to three percentage points: Smokehouse 89.9% pooled vs. 90.5% own; Steakhouse USDT 92.2% pooled vs. 92.0% own. Two vaults move by more in relative terms, those are Vault Bridge USDC 11.7% pooled vs. 5.5% own (2.1x) and Gauntlet 10.3% pooled vs. 5.4% own (1.9x). Both figures are small in absolute terms either way, but the ratio between them would matter to anyone treating a single probability as a firm cutoff. Whether the per vault estimate is actually more accurate is a separate question, and this analysis tested it directly. Each vault's 180-day series was split into a 90-day train window and a held out 90-day test window, a lambda was fit on train data only, then scored against realized daily changes in the untouched test window using QLIKE loss, a standard scale invariant metric for volatility forecasts. Restricted to the seven vaults with enough history for the test (Vault Bridge WBTC, Vault Bridge WETH, and Sentora PYUSD Main all fail to fit on the shorter train window), the results do not clearly favor per vault calibration: the flat 0.94 assumption produced a lower average forecast error across the sample (mean QLIKE 3.34 versus 3.58 for the train fit per vault lambda) and flat won six of seven, with Smokehouse USDT the lone exception. The gap is driven substantially by one vault which is Steakhouse Ethena USDtb's own train window lambda (0.865, fast adapting) forecasts its test window volatility considerably worse than the flat assumption does (QLIKE 6.59 versus 5.76). Per vault calibration avoids a separate, confirmed problem, i.e., a near degenerate series distorting a single pooled estimate, but that is an argument for per vault MLE over a pooled MLE (not over the flat 0.94 convention) which was never fit to this data and was never exposed to that distortion in the first place. On the comparison that actually matters, per vault versus flat, this backtest does not support per vault calibration: flat 0.94 produced the lower average forecast error and won six of the seven vaults tested. The probabilities reported below should be read as one reasonable calibration choice among several similarly plausible ones, however, it is not a uniquely correct answer.
How far vaults sit from their own line today
As of the latest snapshot, Steakhouse Ethena USDtb sits 0.5pp from its own 99.9% stress line, with a 30-day Wald breach probability of essentially 100% (99.6%). Its utilization has oscillated in a sawtooth between roughly 79% and 100% over the past six weeks and is, at any given moment, close to that ceiling by design. Every other vault has materially more room. Metronome msUSD Vault sits 9.5pp below its 98% stress line (51.1% breach probability), Steakhouse USDT and Smokehouse USDT sit roughly 4.9 to 5.3pp below their own lines (92% and 90.5% respectively, driven by high daily volatility, 5.88%/day and 5.34%/day), and Steakhouse USDC sits 10.3pp below its line but with a much lower 22.8% breach probability, because its daily volatility (1.62%/day) is roughly a third of the two USDT vaults'. Gauntlet USDC Prime and Vault Bridge USDC sit 11.9pp and 12.4pp below their own lines with breach probabilities of 5.4% and 5.5%. Vault Bridge WETH, the volatile asset vault, sits 39.7pp below its own (lower) 88% line with a 13.8% breach probability, and the idle Vault Bridge WBTC sits 88.0pp away at essentially 0%. Sentora PYUSD Main sits 16.0pp below its own 98% line with a 3.3% breach probability, comparable to Gauntlet USDC Prime and Vault Bridge USDC in both distance and risk despite being the largest vault in the sample by TVL. Headroom in percentage points and breach probability do not move together: Steakhouse USDC and Metronome msUSD Vault have similar nominal headroom, 10.3pp and 9.5pp, but breach probabilities more than twice apart (22.8% vs. 51.1%), because volatility and drift drive the forward looking estimate.
Six months of history
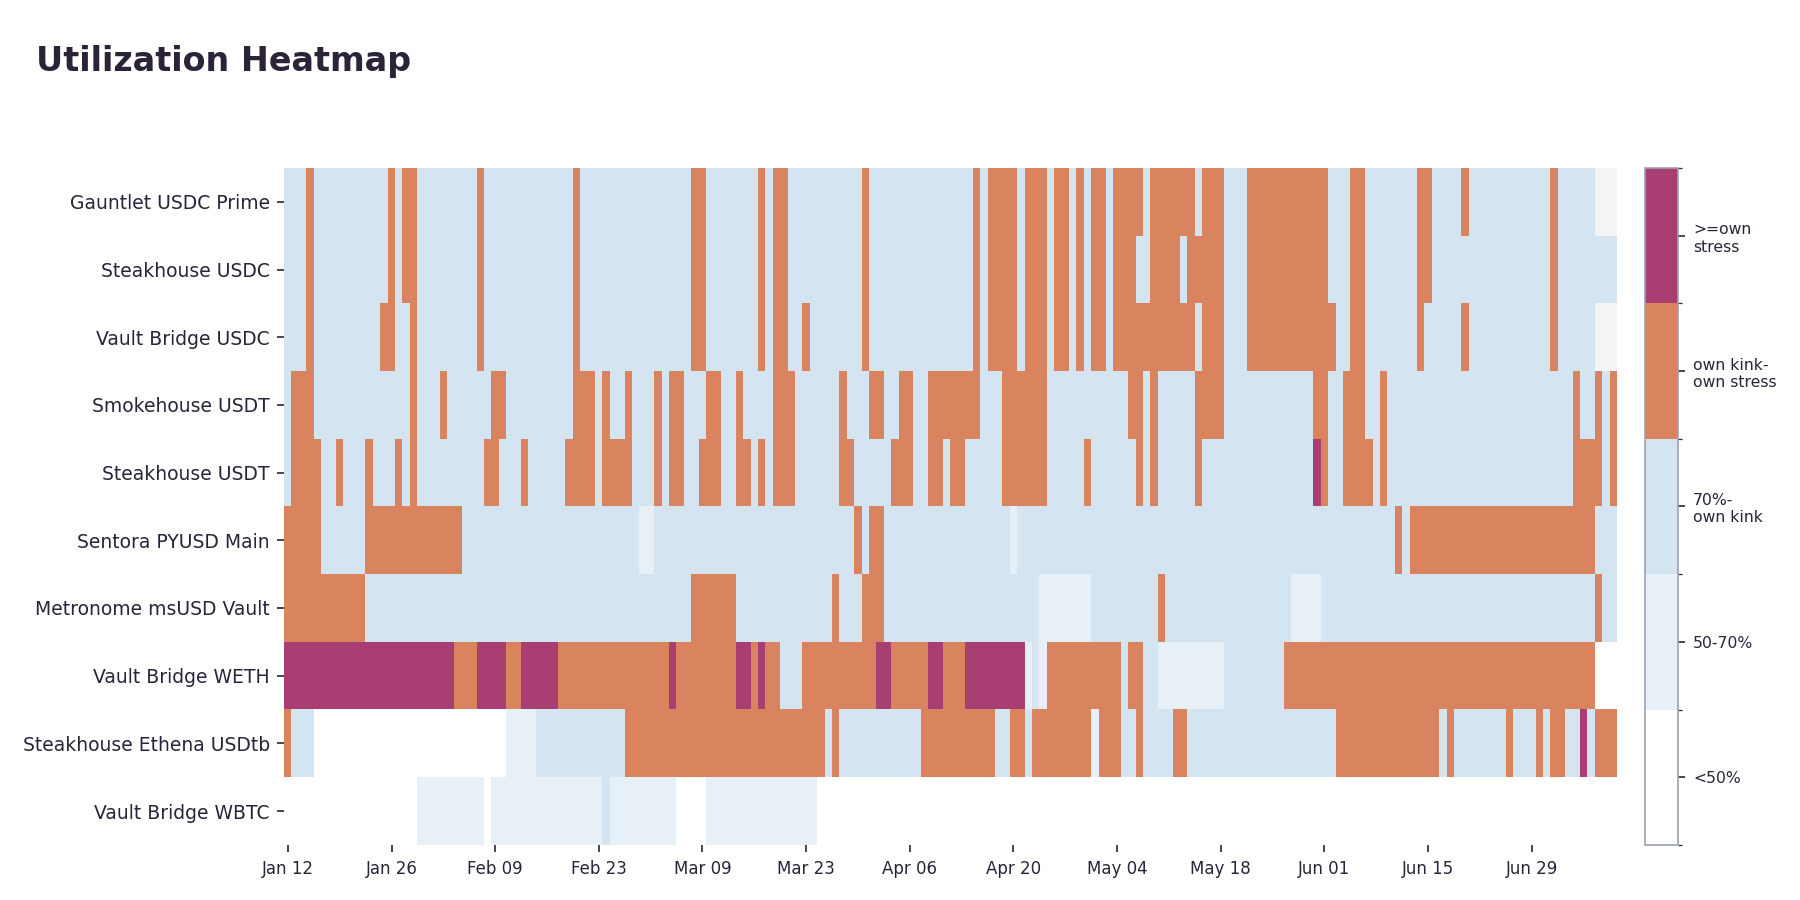
Three of the ten vaults with utilization history crossed their own stress line at least once in 180 days: Vault Bridge WETH, which spent 26.7% of days above its 88% line; Steakhouse USDT, and Steakhouse Ethena USDtb, each of which touched its own line on exactly one day out of 180 (0.6%). USDtb's single flagged day understates its actual posture since the vault's normal operating range brushes its 99.9% ceiling repeatedly without staying above it long enough to register as a full daily average. The other seven vaults, Gauntlet USDC Prime, Steakhouse USDC, Smokehouse USDT, Vault Bridge USDC, Metronome msUSD, Sentora PYUSD Main and the idle Vault Bridge WBTC, never crossed their own stress line once in the 180-day window, a combined $540M in TVL. Time above kink is a different and less alarming story for the stablecoin vaults as five of the seven generic stablecoin band vaults with utilization history spent 29% to 34% of days above their 90% kink, which under this classification is inside the efficient operating band documented for stablecoin loan assets; the other two, Metronome msUSD Vault and Sentora PYUSD Main, spent noticeably less time there (12.8% and 26.5% respectively)
Vaults do not move independently
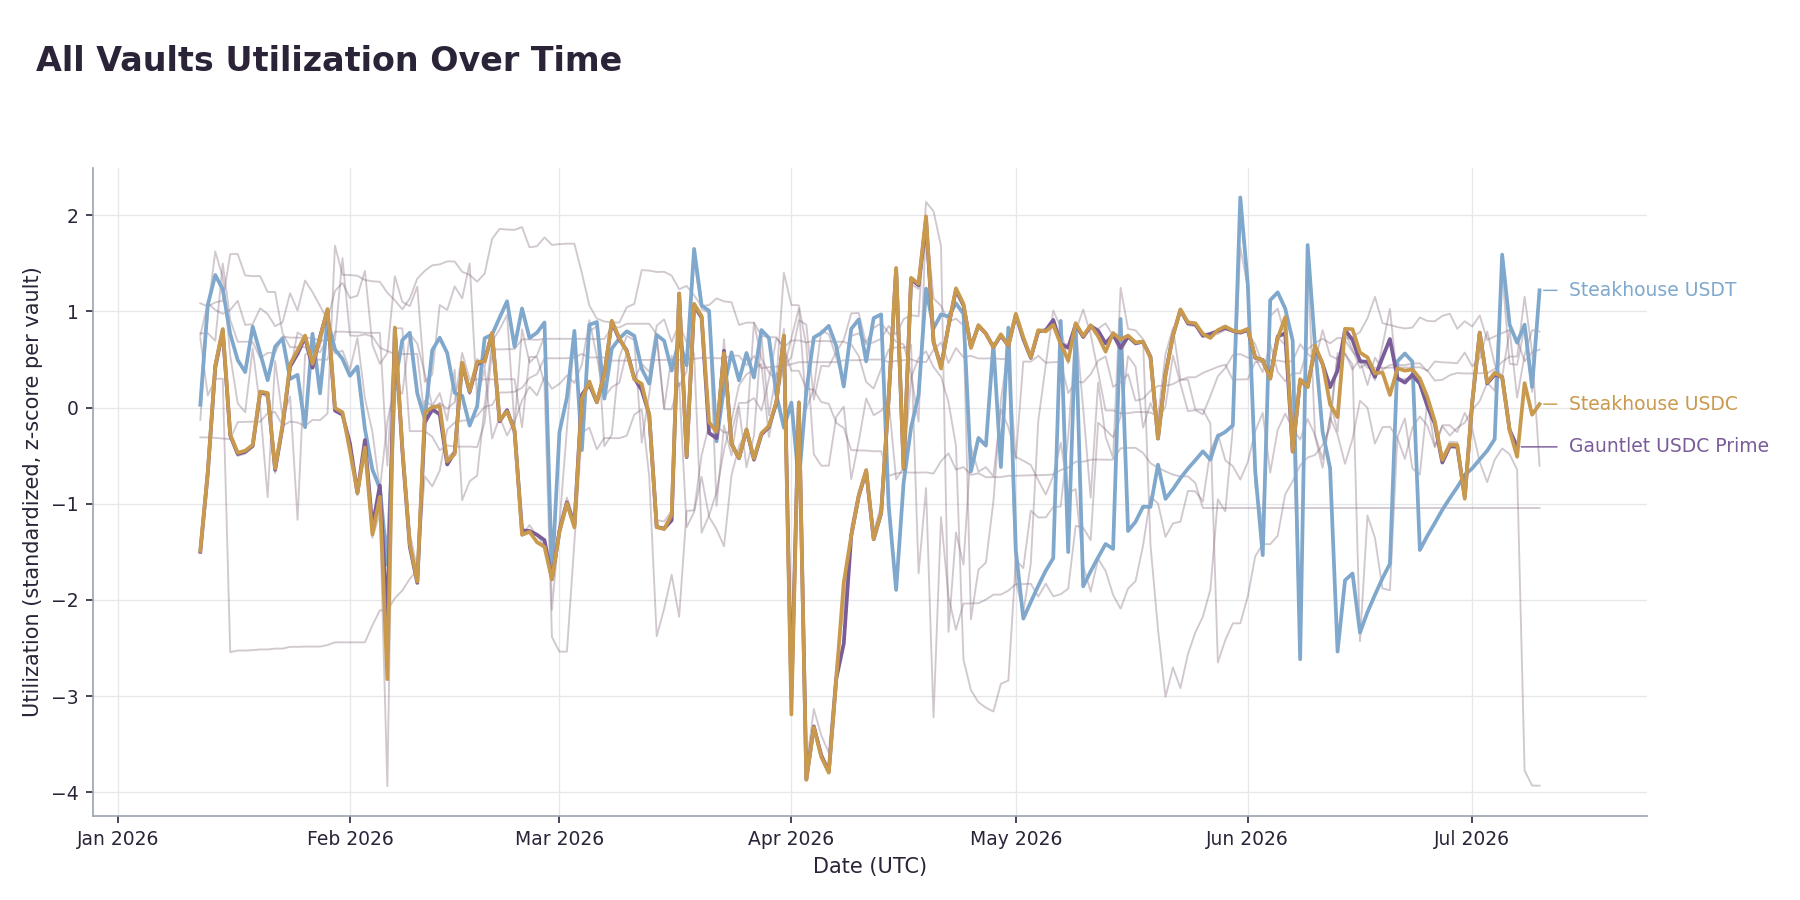
Standardizing each vault's utilization to its own mean and standard deviation removes the effect of differing baseline levels and makes co-movement visible. Two of the three highlighted vaults, Steakhouse USDC and Gauntlet USDC Prime, move in close lockstep for most of the 180-day window (daily utilization correlation of 0.995) despite having different curators, different absolute utilization levels, and different depositor bases. The correlation is consistent with either shared underlying borrow demand in overlapping USDC markets or correlated allocator rebalancing, but this dataset does not identify which, it is reported here as an observed pattern. Steakhouse USDT, the third highlighted vault, is visibly more volatile at the standardized scale, consistent with its high estimated daily volatility and the May 31 stress line touch.
The bank run analogy
The phrase bank run invites a specific mental model where depositors observing a common signal, racing each other to withdraw before the well runs dry, in a self fulfilling collapse. That model holds for Morpho vaults to the extent that all depositors face the same public utilization signal and, in principle, could act on it simultaneously. It breaks in two structural respects. First, there is no lender of last resort. A stressed TradFi bank can be recapitalized or backstopped but a stressed Morpho vault simply stops paying out until utilization falls which is a hard stop. Second, the utilization ceiling caps the damage mechanically meaning withdrawals are not honored at a discount or in a queue that erodes value for latecomers, as in a fractional reserve run but they are blocked outright once utilization binds, and resume once a borrower repays or a new lender deposits. The mechanism that would produce a run, a shared public signal plus a hard capacity constraint, is present. The evidence that one has occurred is not: cross sectional depositor concentration moved by less than 4 percentage points for every vault across the available 13-day hourly window, several vaults by less than 1pp, and the observed utilization spikes trace to curator and allocator activity rather than to a wave of withdrawal requests. That 13-day window is short relative to the 180-day utilization series, and it is also the entire concentration history this pipeline can reconstruct, since it is bounded by how far back the underlying snapshot data goes. Thus, it cannot rule out a run earlier or later in the period, only that one did not occur within the window observed. The honest framing is that these vaults exhibit the structural preconditions for run like illiquidity and by that structural measure only one vault is currently living close to the edge.
Concentration and utilization tell different stories
Two of this analysis's own metrics, depositor concentration and utilization based breach probability, do not move together, and a vault that looks contained on one measure can look exposed on the other. Vault Bridge WBTC is the extreme case: a single depositor holds effectively all vault shares (99.996% top-1 concentration, the highest in the sample) while sitting currently at near zero utilization, having declined from a mid window peak near 70%, 0.0% breach probability, 88.0pp of headroom to its own stress line. By the coordination run fragility measure used in Figure 1 (top-1 share multiplied by one minus cash buffer), WBTC scores 0.000, the lowest in the sample, because there is no utilization driven run channel active to measure. That reading is correct as far as it goes, but it answers a narrow question: it says nothing about single counterparty redemption risk, the exposure that exists simply because one holder controls the vault, independent of how much of the pool is currently lent out.
At the other end, Gauntlet USDC Prime and Steakhouse USDT sit at opposite corners of the concentration distribution, 16.7% and 83.2% top-1 share respectively, a five fold difference. Their utilization based breach probabilities diverge even more sharply, a seventeen fold difference (5.4% versus 92%), and in the same direction. The two measures agree here on which vault is more exposed but they disagree on the source of the exposure, one a depositor structure fact, the other a utilization dynamics fact, and the gap between a five fold and a seventeen fold spread shows the two measures are not simply rescaled versions of each other. Neither substitutes for the other, which is why this analysis reports them as two separate figures instead of blending them into one.
Conclusion
No vault in this sample experienced a depositor driven run over the 180-day window studied. Only one vault currently sits on its own stress line and seven of the remaining nine vaults never touched their own line once in 180 days. This does not mean the sample carries no forward looking risk. Steakhouse USDT and Smokehouse USDT carry 30-day breach probabilities above 90% despite nominal headroom, because their daily utilization volatility is roughly three to four times that of the lowest risk stablecoin vaults, a reminder that distance to a threshold and probability of reaching it are not the same number. The model used to estimate that probability is itself sensitive to a calibration choice that a backtest could not decisively resolve. Depositor concentration and utilization based breach risk continue to move independently across this sample: a fully idle, single holder vault and a vault sitting on its own stress line fail different tests, and collapsing either measure into the other would hide the one it does not capture. The absence of a run in this window is a fact about this window but not a property of the mechanism.